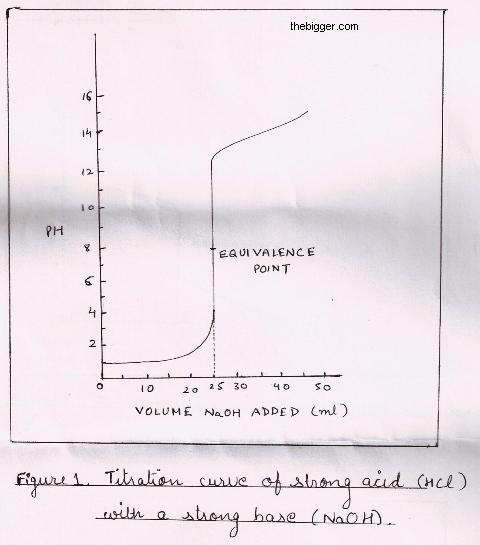
In acid base titration successive amounts of a base are added in acid and the pH of the solution is being noted after each addition. We then draw a titration curve which is the plot of pH as against the amount of base which is added. This titration curve’s shape is dependent on ionization constants of acid and the base which is used in titration.
Titration of Strong Acid and Strong Base
For explaining this type of titration let us consider an example of hydrochloric acid i.e. HCl and sodium hydroxide i.e. NaOH. The reaction can be shown as:
HCl (aq) + NaOH (aq) ———> NaCl (aq) + H2O (l)
As we add the solution of NaOH into the solution of HCl, we notice a progressive increase in the value of pH due to the reaction of OH– ions from base with H+ ions of acid. This reaction leads to the formation of water which then decreases the concentration of H+ ions.
The value of pH increases even after the Stoichiometric point but after that due to excessive strong base in the solution, it levels off. The titration curve is shown below. It is also noted that though the value of pH is 7 at equivalence point but near the equivalence point the value of pH varies from 3.5 to 11. It is due to this variation of pH, we can use any indicator having range of 3.5 to 11 to detect the equivalence point.

